This discussion has been locked.
You can no longer post new replies to this discussion. If you have a question you can start a new discussion

Garmin Connect Courses elevation gain grossly overestimated.

Former Member
Former Member

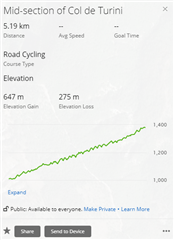
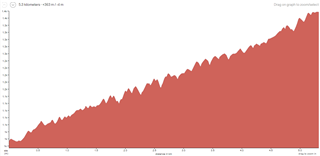
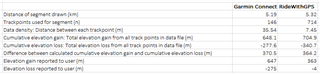
When creating a course on Garmin Connect the elevation gain is grossly overestimated. I can download the GPX and upload to other programs (e.g. strava) and the courses match reality. It is very large over estimate of 30-40% and obviously wrong by inspecting the plot. Anyone else seen this and is there a fix?

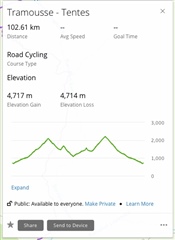
Note same file in Strava is approx 3200m elevation gain.

  • As a further experiment, let's take a closer look at one smaller section of the course in question. Here is Garmin Connect's elevation profile and accompanying elevation gain of the middle section of the Col de Turini climb: https://connect.garmin.com/modern/course/48319446. Garmin Connect reports 647 m elevation gain and -275 m elevation loss.

    As I said, I have cycled this, and yes, this is a through and through climb. Some of the sharpest hairpin turns may possibly be almost flat, but in terms of descents and elevation loss, I cannot remember one single descent during this section. Not even anything resembling it. There is not an iota of chance that there is 275 m of elevation loss in this segment. Drawing the same segment on for example ridewithgps.com gives an elevation loss of -4 m (https://ridewithgps.com/routes/34973782).

    Would you consider this evidence, further to what is presented by earlier, that Garmin Connect's elevation data (gain and loss) are inaccurate?

    That was the elevation loss. Getting back to elevation gain, the elevation gain of the same segment (647 m, according to Garmin Connect) is likely off, as well. The elevation difference between the end and start points of this segment measured by the barometer in my Garmin device (when I rode it) is 342 m. That is close to what is reported on the segment page on Strava (353 m; https://www.strava.com/segments/16861189), naturally so, as I believe most of Strava's segment data are pulled from the original segment creator's bike computer (correct me, anybody, if I am wrong). Ridewithgps.com reports 363 m of elevation gain. Interestingly, looking at Garmin Connect's numbers, if you subtract the 275 m of elevation loss from the 647 m of elevation gain, you get 372 m, which is close to the numbers reported elsewhere. If this is just random, or if sheds some light at what goes wrong in Garmin Connect's algorithms, I don't know.

    In conclusion, this segment is a climb without any descending parts, and Garmin Connect's reported course elevation data are highly erroneous.

  • Would you consider this evidence, further to what is presented by earlier, that Garmin Connect's elevation data (gain and loss) are inaccurate?

    This is no evidence of it being more or less accurate. It is only the evidence of the fact that Garmin calculates the gain differently (I do not tell better!), and doesn't filter any small deviations between points, like others may do.

    I would accept it as the evidence if you did the same as I did, and entered elevations of all the keypoints of the track in Excel and summed them up (increments and decrements separetely!), showing that there is an error in the calculation.

  • I think maybe you are misunderstanding me and the rest here? I think no one is claiming there is a problem with their calculation, but that there are errors in the original values.

    In any event, to please you, I did what you said and downloaded and converted the course file from this middle section of the Col de Turini: https://drive.google.com/file/d/1RNJv9eJT5lENxEVxFDQtXtiijrnjcBxE/view?usp=sharing. The elevation gain and loss equates to what is shown on Garmin Connect, i.e. ~647 m of elevation gain and ~275 m of elevation loss. But what does this prove..? These numbers still do not correspond with the elevation gain and loss of the actual climb.

  • These numbers still do not correspond with the elevation gain and loss of the actual climb.

    You still do not understand that the Elevation Gain is a matter of definition of the term, and the data density, data tolerance, and the filtering of the noise play an important role in it too. There is nothing like the absolute or the final elevation gain that is more true than the other one.

    The more accurate and the more dense the entry data is, the higher the Elevation Gain will be. It is exactly the same problem as with the well-known Coastline Paradox - the more accurate the data, the longer the coastline. And with the elevation gain it is exactly the same. If you start counting the elevation difference of every grain of sand, the total elevation gain will be an order of magnitude higher.

  • Thank you, I do understand that. Data density and filtering are not complicated terms. Can we agree that for what you are claiming to be correct, there has to be descents/"downs" as part of the segment, right, to explain the 275m of elevation loss?

    These "downs" are shown in the green elevation line here, and they are shown by the data points in the file I attached earlier. In the latter, they appear as negative values, sometimes as much as -10 and -12 meters from one track point to the next.

    You are asserting that these values are correct. I am saying they are not. In the present data set, the data density is one track point per about 35 meter. Simple visual inspection of the climb will reveal that nowhere on the climb does the elevation drop 12 meters from one track point to the next one 35 meters away.

  • You are asserting that these values are correct. I am saying they are not. In the present data set, the data density is one track point per about 35 meter. Simple visual inspection of the climb will reveal that nowhere on the climb does the elevation drop 12 meters from one track point to the next one 35 meters away.

    I have no way to visually verify the track in your region (well, perhaps with Google Street), but if you know about errors in the map data, report them to Garmin:

    Reporting Outdoor Map Errors

  • You must understand that the elevation profile in your image is formed from points on the terrain surface. However, a road is built into the terrain so that there is a more or less continuous slope. The profile of the road will never look like your terrain elevation profile. However, for the calculation of the elevation gain, any program can only use the terrain elevation model. No roads, bridges or tunnels are taken into account.

  • I just thought of something. On the same segment on ridewithgps.com (https://ridewithgps.com/routes/34973782) the elevation line also contains the same types of ups and downs (similar to on Garmin Connect, as shown in my last post):

    However, despite these ups and downs across the elevation profile, their reported elevation gain and elevation loss is 363 m and -4 m, respectively. This is, as mentioned many times earlier, much lower than what Garmin Connect reports, and close to what barometric devices report.

    This led me to analyze the underlying course data set from ridewithgps.com (here: https://drive.google.com/file/d/18yTd4PqDsd3Rts7jrU34nZk4ZOGw7mkr/view?usp=sharing), and to compare it with the one from Garmin Connect (new xls version uploaded here for better clarity of the formulas used: https://drive.google.com/file/d/1AMOqRpBlvGBP1O20LdfcPzF6ShVioxXs/view?usp=sharing). 

    All the data and results are in the two files, but here is a summary table:

    Ridewithgps.com apparently uses much higher data density than Garmin Connect (7 m vs 35 m, respectively, between each track point); however they, too, estimate a high cumulative elevation gain and loss (705 m and -341 m) throughout the segment, similar to Garmin Connect. The big difference is the elevation gain and loss they choose to present to the user, which is not the higher cumulative elevation numbers in the raw data, but the much lower 363 m and -4 m, respectively. I do not know how they arrive at these numbers, but I do notice that the elevation gain is almost identical to the difference between the calculated cumulative elevation gain and cumulative elevation loss in the raw data (364 m).

    Somewhere along their decision-making process is a concession that the cumulative elevation gain and loss from trackpoint to trackpoint do not represent the true elevation gain and loss from the actual course as it lies in the terrain, and they thus chose to present the much lower figures, while Garmin either do not agree with this concession or are not aware.

    Bringing it home: my own anecdotal observations is that the higher cumulative elevation gains and losses reported by Garmin Connect do not correspond to the actual visual inspection of this course, and that the same phenomenon is the case for a number of other courses I have seen in the past.

  • All the data and results are in the two files, but here is a summary table:

    Yes, the data perfectly confirms what I am claiming here since the beginning - the finer the data is, the bigger the cummulative gain and loss will be. It is only because Ridewithgps.com applies a noise filter to eliminate the bumps, that it then reports a much smaller value than it actually should, if it did not filter the bumps. However, it is a question of opinion, and (AFAIK) no established standard, to apply the filter, and if so, then to which extent exactly.

  •  i followed this rather theoretical but very interesting conversation for a while. and while something like the coastline paradox or an almost philosophical discussion about the definition of the concept 'elevation gain" are fun to talk about honestly, for me this misses the point of this thread or the whole context of this forum.

    i am almost exclusively interested here at this point in the practical sports usage of a gps watch/ device/service. not so much in the underlying algorithm or way they are getting there. thus there still are some major issues:

    1) all the little descents are NOT there in our perceived reality as  said, he has cycled this. we can talk all about technical realitsation of gps courses and distances between data points, but if i plan a route, i expect it to mirror the reality of the sports situation that i will later meet. concerning the theoretical grains of sand: i am not going up grains of sand when putting my running shoes down on a whole bunch of them and i am not doing micro-climbs and decents on pavement when rolling over them on a 28" racebike wheel. just as i am not complaining about a photograph of reality that has the same "zoom" level as my human eye, for it not being super detailed like a electron microscope. so for me, some filtering is necessary to match the raw data to my 'user' experience when doing the actual route. this i consider garmins job.

    As I said, I have cycled this, and yes, this is a through and through climb. Some of the sharpest hairpin turns may possibly be almost flat, but in terms of descents and elevation loss, I cannot remember one single descent during this section. Not even anything resembling it. There is not an iota of chance that there is 275 m of elevation loss in this segment. Drawing the same segment on for example ridewithgps.com gives an elevation loss of -4 m (https://ridewithgps.com/routes/34973782).

    2) a huge problem is, that Garmin is not consistent with itself, because when you actually DO run/cycle the route, the data that is shown is way less climbing /descending than when you planned it. so the whole thing is not stable. you plan a climb in the alps with 7200m ascent (almost everesting there), but when you do it either the baro or gps of the device shows that you did 2400m of climbing on the trip. this is absurd (and yes - it happens with baro on or only gps, tested both with different watches). i mean at least you need to expect that the whole Garmin ecosystem would be consistent in itself with the calculations, giving you the chance to plan and pick the right routes.

    3) the next and main problem is, that Garmin is offering tools and services that rely on the data that is imported as a course, one being the feature climb-pro that lets you visualize and plan climbs on your route. so when i import a route the 'wrong' way Garmin will show me that a 500m climb i coming up lasting the next kilometer on a trail run. this is a lot for me personally, so i will take it really easy and maybe power hike a bit. in 'reality' its only 50m though and i would easily run the whole thing through. i m not saying that i would't be able to asses the climb i'm in for myself, BUT this is a hugely praised feature for high end garmin devices, so it should work properly.

    same goes for the feature pace-pro that helps you pace through a whole course (lets say an imported trail running race course). if you imported the course via connect, the pace pro strategy would slow you down on those 'exaggerated' climbs to slow walking, when you could actually run through.

    4) a more minor argument: almost ALL other services including the applauded Swiss Topo maps etc have it different, and as i noted in 2) Garmin as well AFTER completing the course. this is why i completely stopped importing via connect an use a workaround. for me it really matters if there are 2400m or 7200m climbing on a bike ride. the first route i might pick, the second route not so much. these numbers from Garmin conflict with all the other online services and tourist infos etc when lets say on vacation bike riding in the alps.

    However, it is a question of opinion, and (AFAIK) no established standard, to apply the filter, and if so, then to which extent exactly.

    This maybe is correct on a technical level, but not so much in the actual pragmatical sports world, as all the others have it different.

    THIS for me is the whole point of this thread: Garmin please change the way of doing this, so that i can use all the features of your expensive sports products in a meaningful way, that fits my user experience doing these courses/ races.