This discussion has been locked.
You can no longer post new replies to this discussion. If you have a question you can start a new discussion

How can I get the timed phase?


I'd like help;
How can I get training sections to know the cardio situation for each training phase?

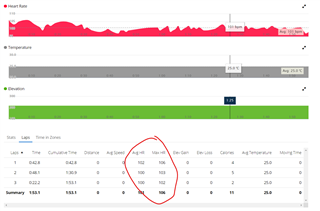
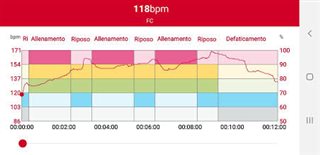
Usually I create activities with many phases of training and recovery at variable times, to test heart resistance and its recovery but, to do this, I need to know how the heart behaves between one phase and another, so I would need sections in the "Heart Rate" tab that allows you to analyze.

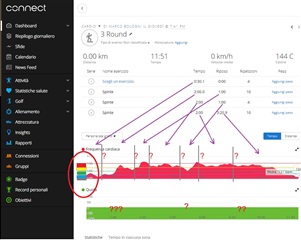
In the image I have shown an example of 3 Rounds to the punching bag, it would be sufficient for the system to draw a vertical line every time the phase changes ... and maybe, the cardio zones in Horizontal

Do you have any suggestions?

  • Yes, that would be useful, and probably not too difficult to implement. I suggest submitting it here: 

    https://www.garmin.com/en-US/forms/ideas/

    Currently, there is unfortunately no such possibility. Some available workarounds (not too comfortable though):

    • Start each phase as an independent activity (I know, that would be a great hassle)
    • Activate the lap button in Cardio Activity Settings and use it to mark laps. You will then get a new tab Laps under graph, with average and max HR for each lap. Unfortunatelly, still no separation in graphs. In plus, the lap button does not play nice with most of cardio workouts, but perhaps there is some way around. I did not experiment too much with it
    • Export the workout as csv file, open in Excel, and analyze it there
    • Use a 3rd party service using the Garmin API (not sure whether Training Peaks would meet your needs, but there may be others)

    I know, that it is not what you wanted, but since it is uncertain when and whether Garmin implements it, you may try investigating the other alternatives.

  • Thanks for the reply,

    several times I sent this suggestion to the Ideas link, but perhaps it is of little interest.
    I currently use an old Polar watch on another arm which allows this ..
    I hope there is in an update.

  • Another hack or a workaround would be using the overlays in the full-size version of the graph (after clicking the double arrow symbol in its upper right corner). You can also merge multiple graphs with the help of the overlay feature (see the dropdown selection top right on the full-size graph screen)

    Since the cardio activity also shows the graphs for elevation and temperature, which are more or less useless in most cases, you could try to use them for marking the phases. For example if you have the barometric altimeter, and can do one exercise on an elevated podium or a floor, and the next one lower, and so on, then the elevation graph in overlay would serve to identify the phases.

    Or you could put something hot, or cold close to the temerature sensor each time you change the phase. Having a jar with ice near you, and briefly putting your hand with the watch into it, could perhaps work fine for that purpose. Opening then the HR full-size graph with the temperature overlay would then show you the phases separated by temperature drops.

  • All excellent ideasSunglasses ... which I will try but, consider the conditions; The workouts are called "Cardio Circuits" consist of very quick steps eg:
    - Climb the rope, 20s + 10s Recovery
    - Punches to the bag (with boxing gloves), 2min + 1min Recovery
    - fast running shots, x10 + 10s Recovery
    - Bend over arms, 20s + 10s Recovery
    - Squot jumps, 20s + 10s Recovery

    in this example there are 10 complex stages to be managed, but it is important to see the individual phases that I will be able to compare when I repeat the "Cardio Circuit"

  • Hm, yes, for such quick changes the temperature sensor would be likely too slow, but perhaps you can give it a try anyway.

    Back to the workaround using the lap-key: in fact, I practically stopped using the programmed plans and workouts, because with my weak sight, I can't read the exercise names and notes written with tiny letters on the watch, and am just using the generic bare-bone activities. I start a generic Cardio workout, either remembering the individual exercises, or improvising, or having notes with bigger letters with me. I can then use the lap key for separating individual phases, without interferring with the preprogrammed structure. The laps are then visible in the Activity overview with separate statistics, including the Avg and Max HR. 

    So if you do not need the watch showing you the names of the exercises, that could be a way, to get a little bit better structured data (though still no clear separation on the graphs).

  • I just created a quick example (not a true workout) to show how it looks like with the laps:

  • I have seen but I was hoping for something like my old Polar

  • I have seen but I was hoping for something like my old Polar

    Yes, I know, but unfortunatelly, I do not know about a workaround that would give you such graph. Except of a 3rd party solution, or the analysis of the exported activity file.

    Try checking out the 3rd party websites with interface to Garmin. Perhaps you can find some with a better exercise analysis. Some of them are listed for example here, but you may find more on Google:

    https://support.garmin.com/en-IE/?faq=8L3Z4gEmTk6sXV7ido1Uz6