This discussion has been locked.
You can no longer post new replies to this discussion. If you have a question you can start a new discussion

Set Y Axis for Dashboard Weight Graph/Widget

Former Member
Former Member
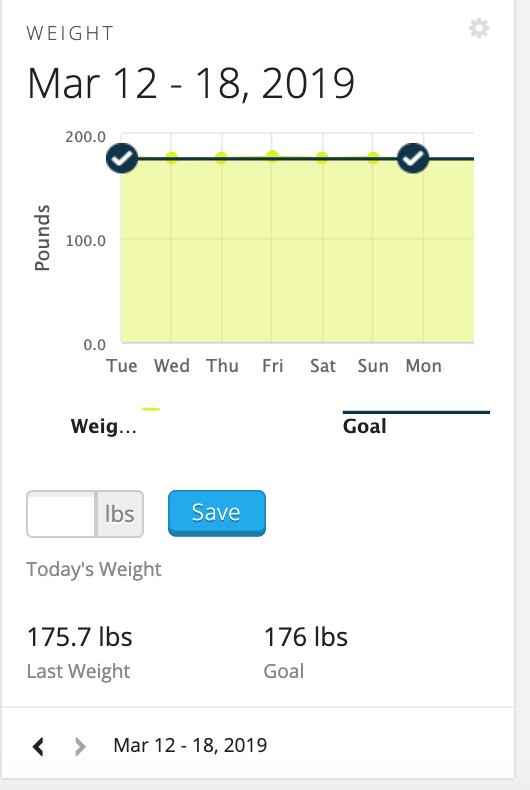
Really like the dashboard view, however the weight graph/widget (see attached) does not allow the user to set a Y-axis minimum.

It instead goes from 0 to whatever weight you are, making the changes in weight so minor that you can't make sense of it.

I'm aware you can zoom in, however it takes about 3 zooms to get it right and it doesn't save. ciq.forums.garmin.com/.../1465687.png
  • I'm building on. I would like to be able to set for in the Android app. At one point, I put an aggressive goal, and now (I think) the axis takes that into consideration with the minimum, so the graph isn't as useful as it could be. The 7 day, for some reason is about 100 lbs less than my current weight, so it's even less useful. I wish this could be set by user.
  • I think all the Y axes of all the graphs, at least on the web and on zoom should be customizable.
  • I hear you guys. I just tried for 1/2 hour to figure out how to adjust the y-axis. As a widget on my dashboard, it's currently useless since even 10 pounds of progress is imperceptible.