
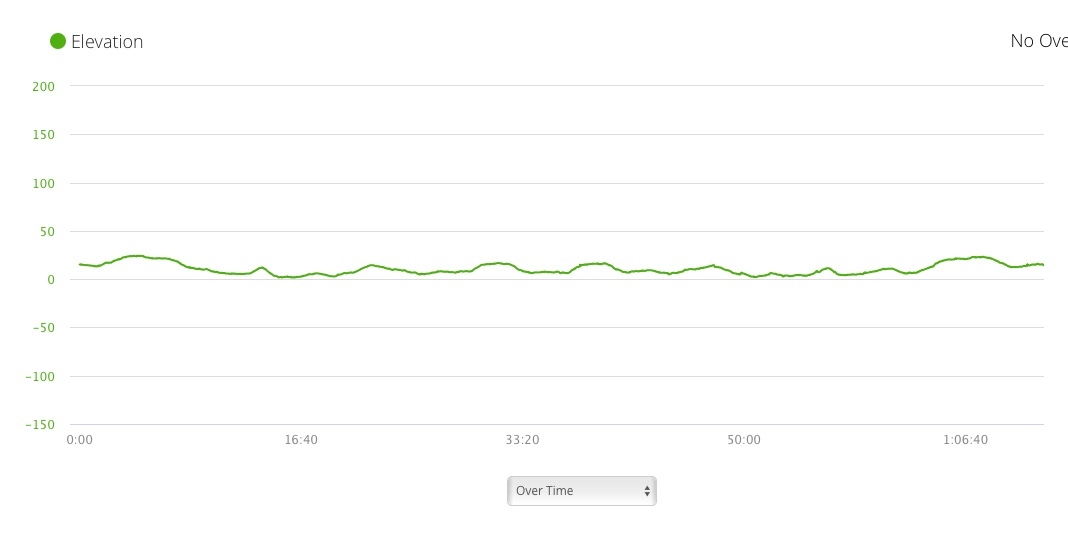
It would be great if Zoom could be applied to the elevation (and maybe some other) chart on the y-axis (elevation), not just the x-axis (distance or time).
I usually find that e.g. a rolling hill run like the attached image is not discernible because the y-axis covers such a span (-150 to +200m). In the attached I ran back and forth over a 1.1km bridge so meaningful elevation change on what was meant to be a rolling hills course. But you'd hardly know it from the picture. If it's shorter hill repeats likewise, they don't show up.
