
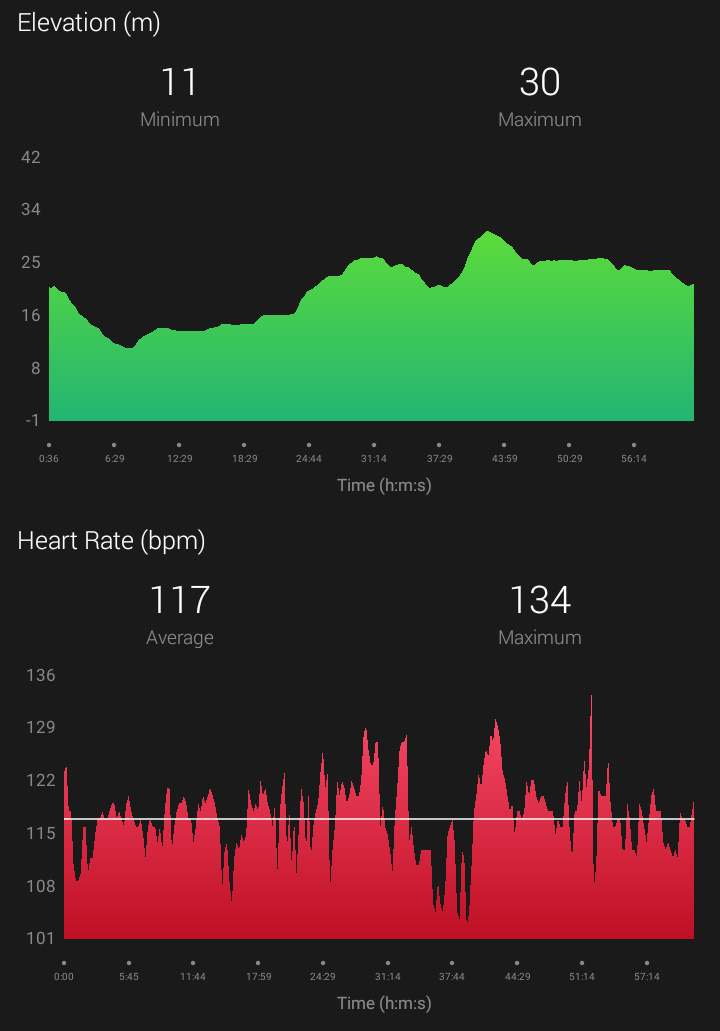
I live in Denmark, so any elevation changes I have are pretty small. When I look at an activity in the Garmin Connect app (on Android), it nicely scales the graph axis so the changes in elevation is visible, like: https://i.imgur.com/s66EpDK.jpg (sorry about not putting pictures in here directly, I get JavaScript errors here on the forum every time I try to submit with pictures :/ I've attached the pictures down below as well )
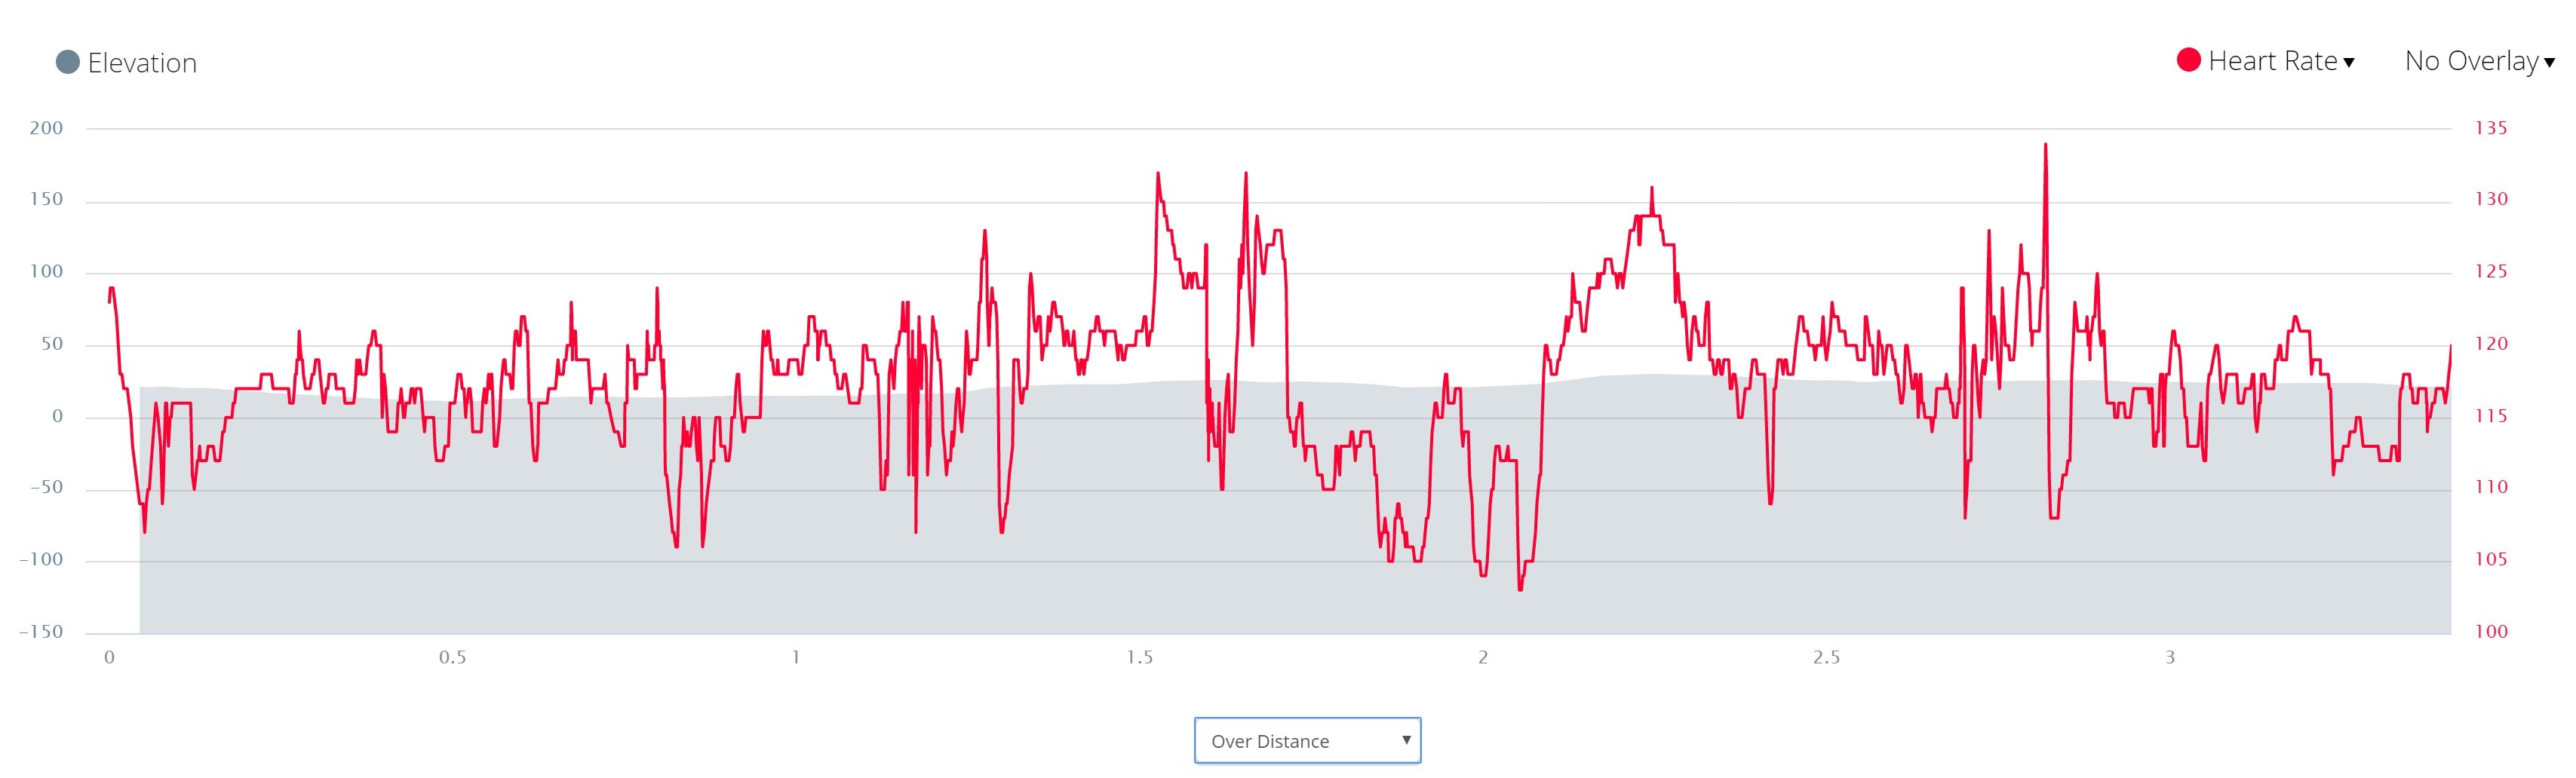
However, if I have a look at the zoomed in graph (or even just the non-zoomed in version) on the Garmin Connect website on PC, the elevation graph is not scaled at all, and seemingly goes from and to some standard value. This means that I can barely see the elevation change, because my changes are fairly small. It looks like this: https://i.imgur.com/HfPcHNK.jpg
For comparison, it seems like the corresponding graph for heart rate does the correct thing on both the app and website. Am I missing something? And if not, where could I maybe write and add this as a suggestion or as a bug report?
I'm not sure if it matters, but I am using a Forerunner 235 to log my walks. ciq.forums.garmin.com/.../1376932.jpg ciq.forums.garmin.com/.../1376933.jpg
