This discussion has been locked.
You can no longer post new replies to this discussion. If you have a question you can start a new discussion

Lactate Threshold bug in GC

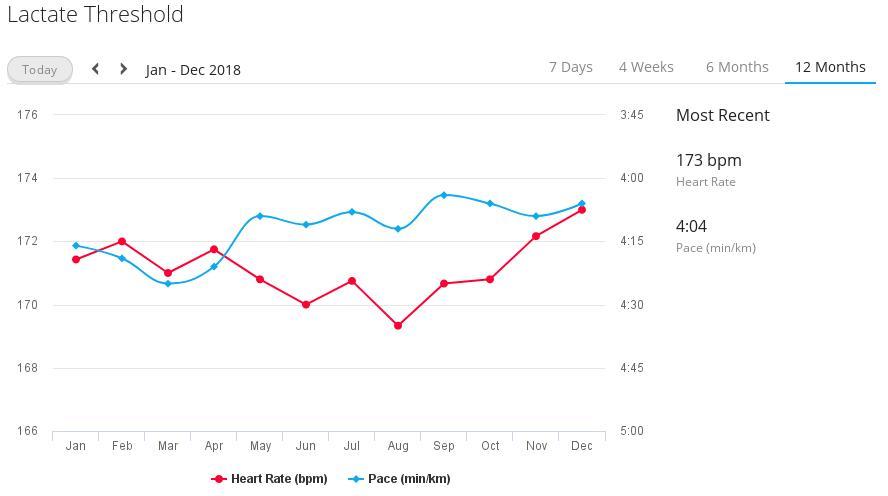
Hi there. Today my FR630 detected a new Lactate Threshold (7:03/mi 162bpm) but once it got uploaded to GC it shows up as (1:58/mi 162bpm) which screws up the whole plot. Is there a way to remove the measurement without removing the run which is otherwise fine? I am attaching the LT plot as shown at GC to see what I mean:
  • I deleted and re-uploaded all 11 activities between May 20th and July 7th containing LTHR values that had wrong LT values - all of them have valid HR and LT values now, no LT drop outs like KALAMARIOS mentioned two posts above. Thanks for posting the workaround.


    I am glad it worked for you and you are not missing any LT-Pace values. Garmin contacted me and asked for the FIT file that generated a LT-HR and no LT-Pace entry to try to debug it. Hopefully that last bit will be resolved.

    In terms of your second comment on the axis, I completely agree that it needs to be fixed but another idea that I read somewhere in the forums is for Garmin to allows to set our own *fixed* scale for pace throughout the website. This way it will be super to just visually compare two runs just by looking at where they "fall" on the plot (higher lower). If we let the axes auto-adjust then all runs will appear smack in the middle.
  • An update on my part: I submitted a FIT file to Garmin support for them to evaluate why the LT-Pace value was not calculated but the LT-HR was.

    Moreover, as far as I know the incorrect past values of LTHR/Pace have not been fixed for people (unless they went the manual way described above).

    Lastly as you can see in the picture below, the LTPace axis is way to wide (pace 4:29 - 13:25), essentially "flattening" out the plot; it's basically useless. LTHR axis on the other hand is "correct" in the sense that it captures a "tight" min/max of HR values (163-168). Garmin, can we please have our LT functionality back?!?

  • Any news?

    Any news on this problem?

    Best regards,
    Palle
  • Former Member
    0 Former Member
    Any news on this problem?

    Best regards,
    Christiano
  • Former Member
    0 Former Member
    Any news on this problem?

    Best regards,
    yrchern
  • I think that Garmin simply fixed the LT calculation problem going forward but didn't address all the past LT values that have already been screwed up.

    Way to go for a $500 watch Garmin!
  • Former Member
    0 Former Member
    up the thread!
  • Former Member
    0 Former Member
    up the thread
  • An update on my part: I submitted a FIT file to Garmin support for them to evaluate why the LT-Pace value was not calculated but the LT-HR was.

    Moreover, as far as I know the incorrect past values of LTHR/Pace have not been fixed for people (unless they went the manual way described above).

    Lastly as you can see in the picture below, the LTPace axis is way to wide (pace 4:29 - 13:25), essentially "flattening" out the plot; it's basically useless. LTHR axis on the other hand is "correct" in the sense that it captures a "tight" min/max of HR values (163-168). Garmin, can we please have our LT functionality back?!?


    Just wanted to point out that it's now a whole freaking year later and Garmin has still not addressed the ridiculous-looking LT-HR and LT-Pace plots, especially on GCM. Pretty sad :(
  • Former Member
    0 Former Member
    Yeah! Finally! It has been fixed :) !

    I had the problem since June 2016 (caused by the bug in firmware 7.0) and had lost hope after the initial promises from the Garmin supporter earlier in this thread.

    Last week, the graph in GC was still messed up (essentially flat pace graph due to extreme scale limits), but now there are reasonable values (see attached screenshot).

    Thanks a lot Garmin for this 'christmas present' !ciq.forums.garmin.com/.../1433568.jpg