Training load per week

Hello Garmin users! Is there a way to get the weekly training load shown in an 8-week / 12-week period?

As any training programme is generally based on a range of 8-week ¸ 24-week durations, I guess it would be very useful to see on the GC and on a watch statistic screen the progress of weekly load volumes.

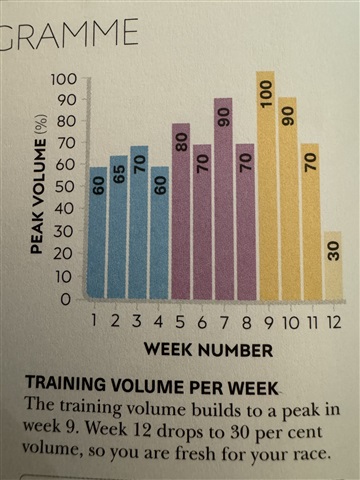
I attach below an example (from a 12-week training program for a half marathon) of the kind of bar graph I would like to see.

Also, having the option to have separate graphs for running, cycling and swimming training loads (when preparing for an event of a single discipline) or a combination of them (e.g. training for a duathlon or a triathlon race) would be great.

(I posted this on the F7 forum as well – sorry for the duplicate!)
Top Replies

All Replies

  • The 7-day training load graph is a bit what you are looking for. It isn't divided into calendar weeks. Instead it will show you in 7 day periods from today and back. In the app you only see 4 week periods, but in the web you can select to see up to a year in the same page.

    https://connect.garmin.com/modern/report/-1/all/last_six_months 

  • Thanks! The 6-month graph on the web is close to what I’m looking for, although it refers to the aggregate load of all activities and you cannot filter by single discipline.

    I guess an alternative would be to create your own excel spreadsheet/bar graph with loads for each discipline and input the data manually…

  • it refers to the aggregate load of all activities and you cannot filter by single discipline.

    Filtering by discipline does not make much sense at the Training Load, because the load you get from other disciplines impacts your training status, training readiness, and performance anyway, even if it comes from a different discipline. The Training Load is an equivalent of the EPOC (excess post-exercise oxygen consumption), and it does not matter much from where the EPOC comes, in order to impact you.

  • Many thanks! I thought it would be useful to isolate the load of a main activity (e.g. running when training for a marathon) from the load of complementary cross training activities. But your statements sound right and your comment is absolutely pertinent.

    I guess if you want to track the volume of running during training (separately from other cross training activities) you can refer to running distance (although it’s not the same as running load). 

  • You could also look at the running Calories: https://connect.garmin.com/modern/report/1/running/last_seven_days 

    In certain way it reflects not only the distance and duration, but also the effort.

  • Thanks! Agree that tracking active calories can be a good alternative to monitoring the training load. However, the 6-month report shows monthly, rather than weekly, total active calories (unlike the training load report which shows weekly values), and this makes it useless if you aim to a good tracker of the training volume trend in the last 8-12 weeks.

    It is not the end of the world as the GC app and website provide decent info about your training volume, but I think there’re margins of improvement for a detailed training tracking.

    I believe that in the TrainingPeaks app (premium, which I don’t have) you can customise the charts to get, for example, TSS (training stress score, i.e. training load) per sport type in any date range you want - which is what I’m looking for. So, in my case, I guess an easy solution could be to buy the TP premium package Sweat smile , but wanted to check first if I could get the desired info directly from a Garmin app. 

  • The 4 weeks report normally does show the weekly values. Just it seems to be broken now, and there is no graph at all (at least on my side), though I think it was still working when I looked at it earlier today. Hopefully it will be back quickly.

  • Thanks for all info and tips! Yes, the 4-week report shows the weekly values, but my original query was about whether we can get weekly values (ideally load values) in a single 12-week report. Obviously you can check separately three 4-week reports, but you may miss the visual clue of the whole progress. 

    I wrote ‘12 week’ because generally a typical training program is based on a 12 week duration. So I guess it would very useful for anybody who wants to track their training to see weekly training values (load, active calories, distance, etc) in one single chart for a customisable duration (in GC you have only 3 options: 4 week, 6 months, 1 year).

    The bar chart I attached gives immediate visual info on the load distribution for the whole training programme, so I wondered if you can get something similar in GC.

    My conclusion is that you cannot get that report in GC mainly because the lack of customisable duration in the charts (which is a limitation IMO).

    Thanks for the comments and info anyway. Very useful Slight smile