This discussion has been locked.
You can no longer post new replies to this discussion. If you have a question you can start a new discussion

Absurdly High HR Graph

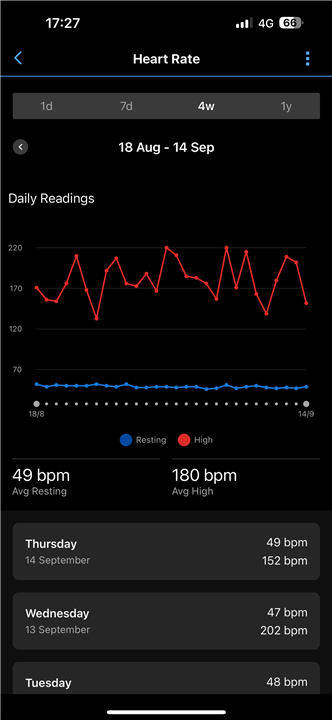
Since the last update the HR Graph for ‚high‘ shows absurdly high values at some days. My max HR is around 184 but the graph shows values over 220 (see picture). When I enter the day in question it is normal. Just the overview (red line) is messed up.

  • What's even more confusing it that even these "high" Hr values do not match up with the ones on connect web (Reports - Max HR) - not a single one of the last week matches.

  • I am seeing these HR spikes to, very confusing...

    In week summary they can bee seen, but if you look  at the day view they don't seem to be there...

    I'm also seeing missing data in LTHR graph where bpm is missing. 

  • Max HR and High HR are two completely different values:

    Understanding How High Heart Rate and Max Heart Rate Values Are Calculated | Garmin Support Center

    For the High HR, go to the all-day HR graph for given day, and check what the value of the highest peek is. In my case the values between 7d, 4w, and 1d match perfectly.

    Why it is so high in your case is another question. It can be due to an improper fit of the wristband, cadence-lock during a run, or even due to some kind of arrhythmia. Some tips are available for example here:

    The Heart Rate Sensor on My Garmin Watch Is Not Accurate | Garmin Customer Support

  • Also, please note, that the "High HR" is the highest value from the all-day HR data set. And since the all-day data is sampled each 15s, and recorded as averages over 2 minutes, the daily High HR will be usually quite a bit lower than the highest HR recorded during an activity (which is sampled and recorded with up to 1s rate).

  • Thank you for taking the time to answer. I know of the difference, just wrote about my max HR to say that i have never gotten values so high.

    I first also though of the watch locking onto cadence on a trail running downhill section or such. I checked the activities and was wearing a HR strap (Garmin HRM Pro ) with good battery. That's why i do not think the activity HR data is wrong (it never showed 220 anywhere). Also when checking the actual single day the "High" HR is a totally different and completely reasonable value. For example the single day of Sept 9th shows  high of 139 for the day - i just did a very easy trail - completely makes sense. Only the 7d oder 4w views randomly shows a different number.

  • Also, please note, that the "High HR" is the highest value from the all-day HR data set. And since the all-day data is sampled each 15s, and recorded as averages over 2 minutes, the daily High HR will be usually quite a bit lower than the highest HR recorded during an activity (which is sampled and recorded with up to 1s rate).

    exactly one more point that this probably is some App Bug.

  • Could you post a screenshot of the 1d HR graph for the 9th September?

  • Exakt the same behavior for me. This is not how it used to be, almost feels like extreme outliers and not filtered out in week/month summary... 

    I have a max heart rate of 187

  • yes that looks exactly the same. i just viewed the data for sept 9th in Apple health. All the 2 minute intervals, that mentioned are there and neither data nor graphic are showing anything close to 200bpm