This discussion has been locked.
You can no longer post new replies to this discussion. If you have a question you can start a new discussion

Problem Chronic Load not displayed

I’ve been transferring my Chronic load and Acute Load numbrs to a spreadsheet so I can see different format to Garmin. I’m trying to understand the maths behind changes overnight (no issues there)

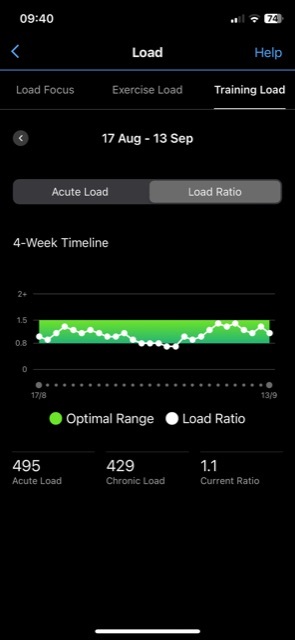
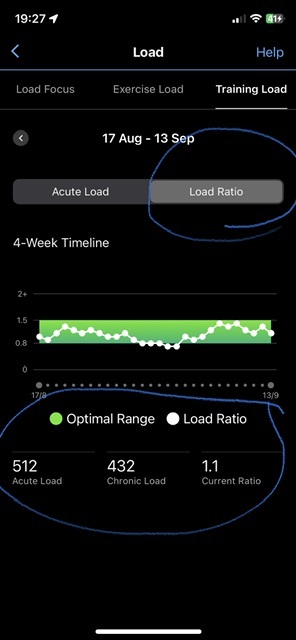
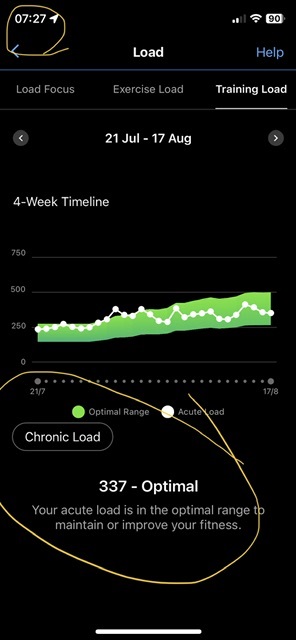
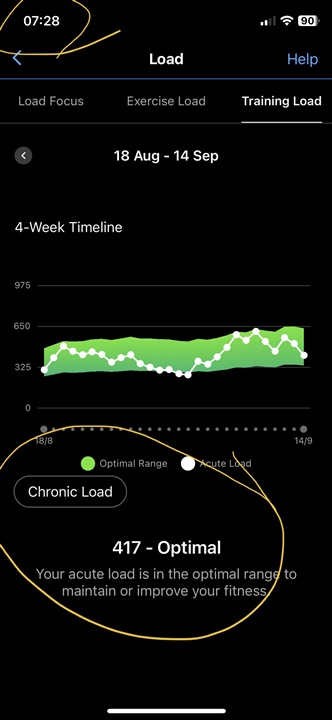
I’ve included pictures showing an issue today - Load Ratio info (2 pics) yesterday & today 2 more pics plus this morning within 1 minute of change.

This morning, I noticed that an update to Connect  night removed the overnight update of Chronic Load. 

After initially displaying Chronic Load number (337) the number in the App changed to the same as Acute Load (417). The Chronic Load and Acute Load had updated overnight but then disappeared. 

Additionally, the previous Load Ratio data and chart is no longer displayed.

  • One additional pic showing what happens when I select the ‘Chronic Load’ button.

    At the bottom the description is about ‘Acute load’ 


  • One additional pic showing what happens when I select the ‘Chronic Load’ button.

    At the bottom the description is about ‘Acute load’

    That's normal. The hint refers to your Training Load in general, telling you whether you are in the optimal range (acute/chronic load ratio range) and does not change when you press the Chronic Load button. That button only turns on or off the orange Chronic load (which is the baseline of the Optimal Training Load range).

    Not sure what other questions you had, since you did not formulate any specific questions, but if you ask why the Ratio was taken away with the atest update, then it was not documented why it happened, so we can only speculate. Personally, I think it was taken away to simplify the report, and to make it easier understandable. It was rather redundant anyway - you see on the first look on the Training Load graph whether you are within the optimal range (optimal a/c ratio), or not, so adding the ratio just unnecessarily makes it harder to understand for people not exactly familiar with the way the data is calculated.

  • Thanks. I see what you mean.

    personally, I like the load ratio view with Acute and Chronic load numbers. It weird to press a button ‘chronic’ and get an explanation about ‘acute’ load.

    I wish that Garmin would summarise changes. 

  • ... otherwise, if you want to see the numerical values of the ATL and CTL, then simply tap & hold on the graph, and the values appear in the tooltip

  • Yes. I found that later today. I’m fairly sure that the chronic info wasn’t there previously hence why it was good to see below.

    thanks for following up

  • The load ratio chart has disappeared from Garmin Connect — please bring it back!

    • It is still on the android I found out.