Hi,
I have built a DataField that stores and displays three graphs in ConnectIQ : apps.garmin.com/.../f8749e1f-ab5a-49b5-9431-fb164b7445c3
The graphs display correctly in ConnectIQ, but...
There are bugs in Garmin's ConnectIQ app that make it impossible to select graphs for display as follows;
1. Regardless of which graph is clicked on, it is _always_ the first graph displayed as full screen
2. Regardless of which overlay is clicked on, it is _always_ the first graph used as the overlay
That's the tl;dr, more detail and screenshots below.
G
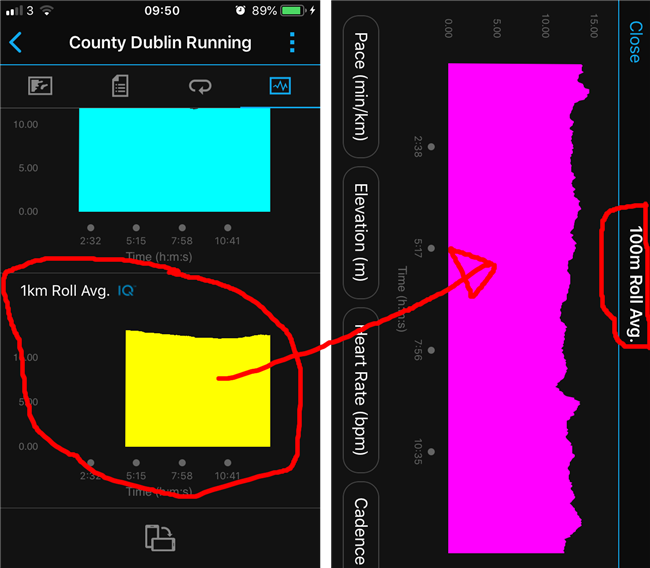
1. SELECTION OF GRAPH BUG
To replicate: After verifying all three graphs are correctly stored and displayed, click on any of the three ConnectIQ graphs.
Expected result: Should display the correct graph in full screen mode.
Actual result: Displays only the first graph, regardless of which one clicked.
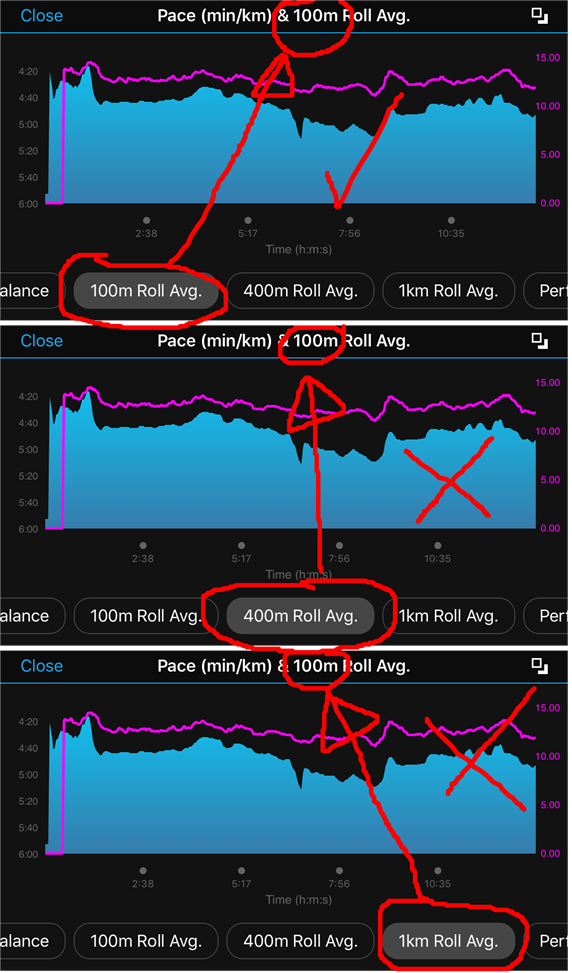
2. SELECTION OF OVERLAY BUG
To replicate: Select any of the standard graphs in full screen mode, eg: click on "Pace". Then select any of the ConnectIQ graphs as an overlay.
Expected result: The correct graph should show as an overlay.
Actual result: The overlay will always be the first graph and the title will always be the first graph even though the selected button updates.