
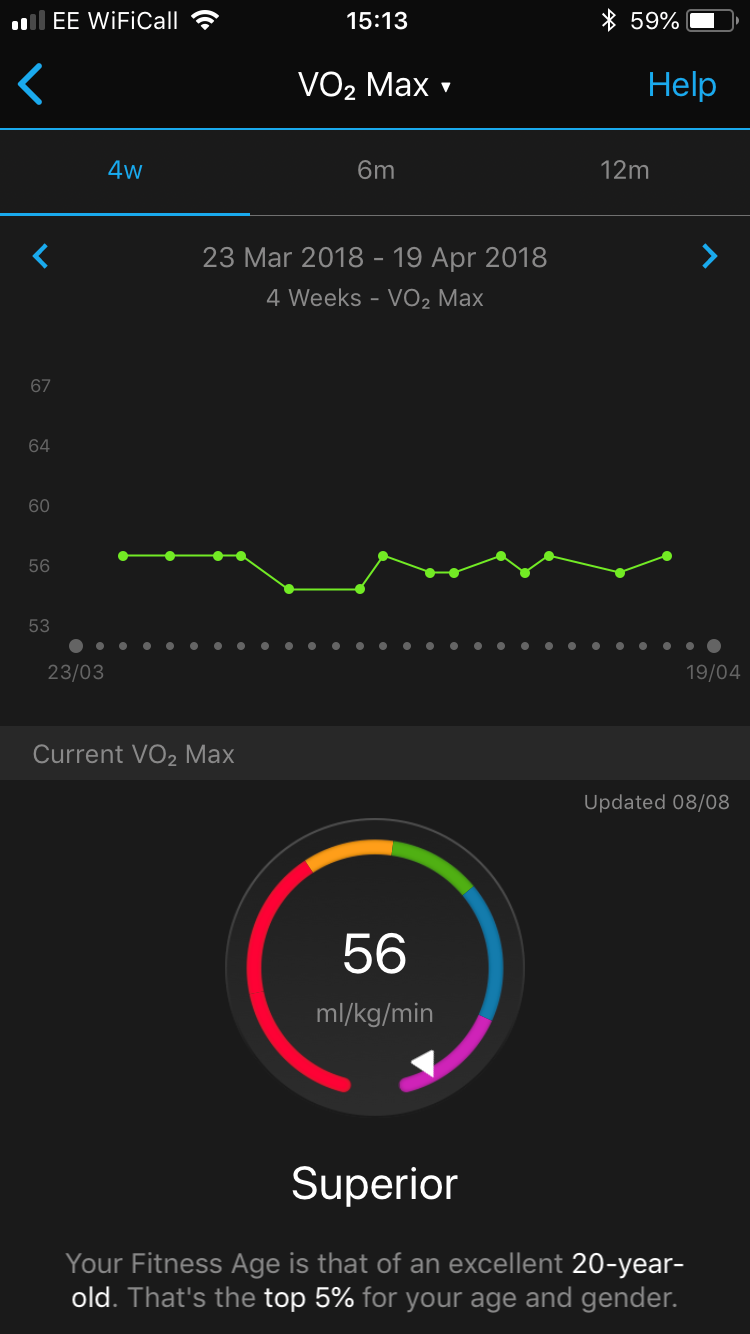
Until mid May this year I had a 920XT - VO2 Max was pretty consistent, hovering around 55-57 as can be seen in the March to April screenshot.
I sold my 920XT and bought a new FR935 mid-May and expected it to take a few weeks for my VO2 to catch up on my new watch.
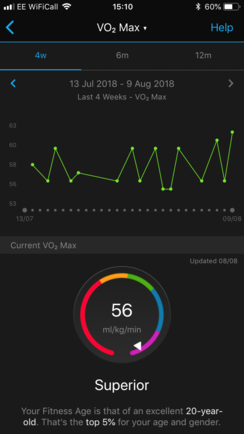
Two months on and the VO2 Max graph is still all over the place, as can be seen in the July to August screenshot.
The Cycling VO2 Max for July to August is much more what I'd expect to see, as the Current VO2 Max value matches the graph.
What's the explanation for the main VO2 Max graph being so all over the place? Why does it show my Current VO2 Max as 56, but the graph shows spikes of 62?
GCM Diagnostics show app version 4.9.2.1, GCS version 4.9 on an iPhone 7 on 11.4.1, 935 is currently on beta FW 9.73 ciq.forums.garmin.com/.../1386826.png ciq.forums.garmin.com/.../1386827.png
