
The weight trend graphs (7d, 4w, 1y) should show an interpolated value for data points outside of the observation window.
For instance if I've made a weight-in on a Wednesday and my last weigh-in was the Friday two weeks prior, I want to be able to see a trendline from the beginning of the week which has an interpolated value to the previous data point to my current data point.
Then even if I only have one data point, I can tell if my weight is up or down from the last weigh-in.
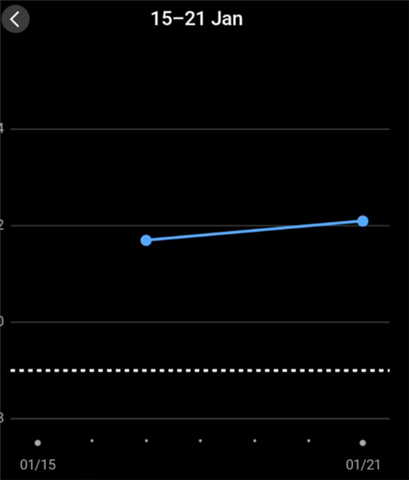
This is what Garmin Connect shows:
The image below is what I'm asking for:
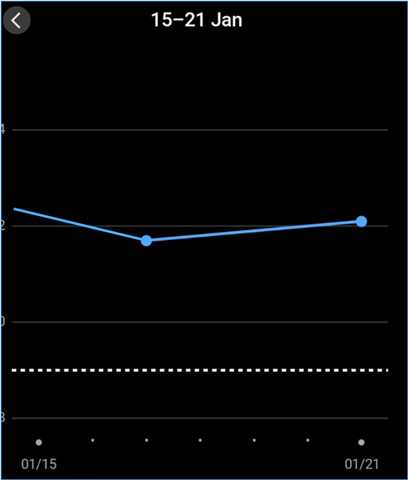
Notice how the interpolated line doesn't have a bullet. That makes it clear that there is not an actual data point there.
I would expect the same logic should be applied to any (continuous) line graph on the connect app.