This discussion has been locked.
You can no longer post new replies to this discussion. If you have a question you can start a new discussion

Bug: Wrong average calculation in activity charts

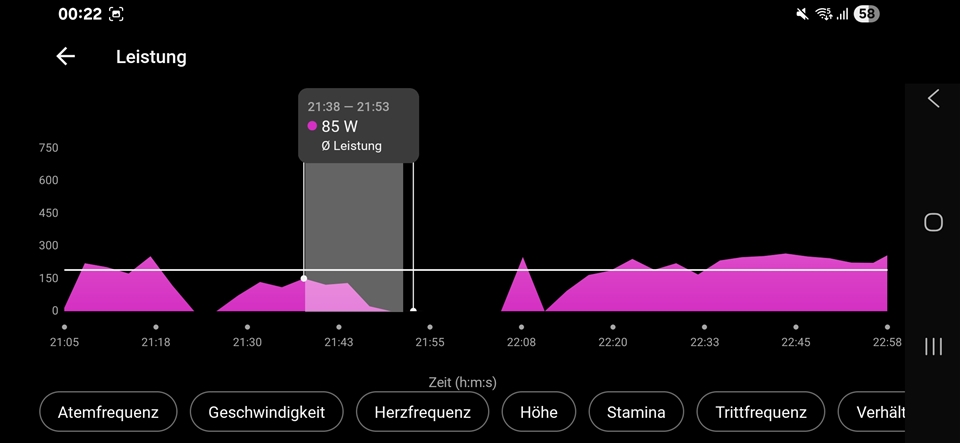
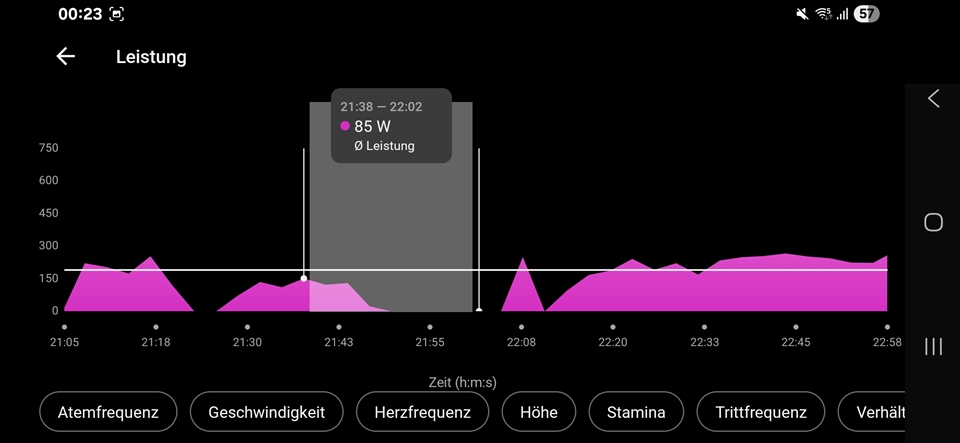
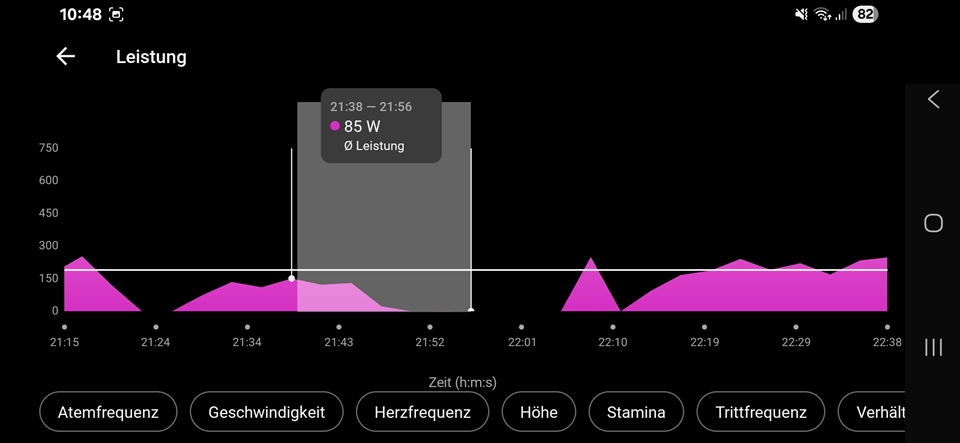
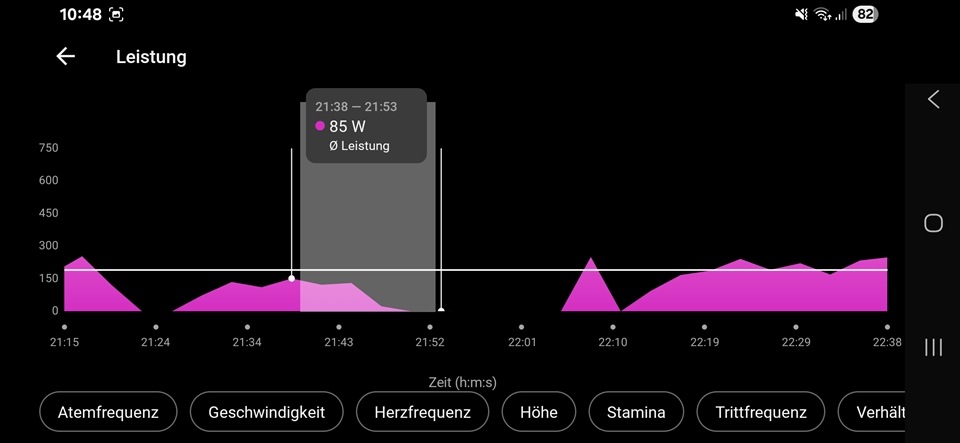
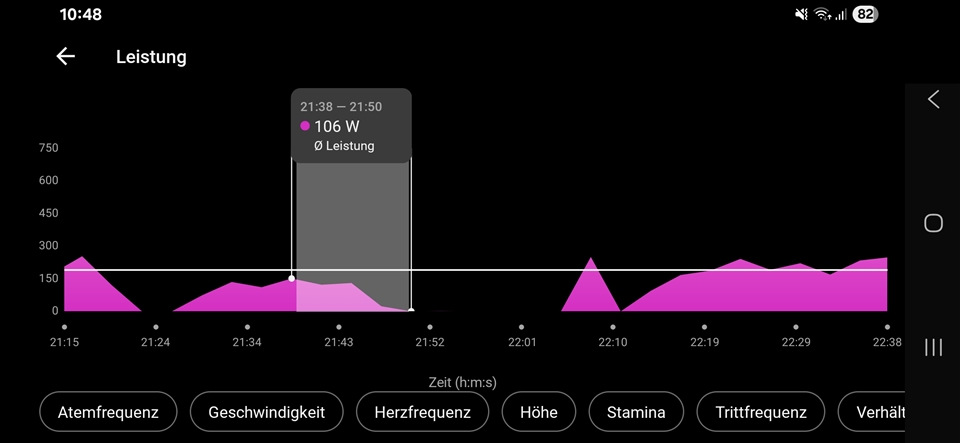
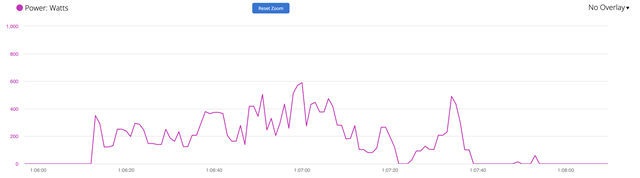
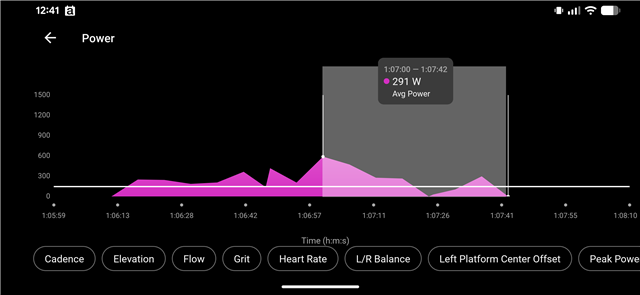
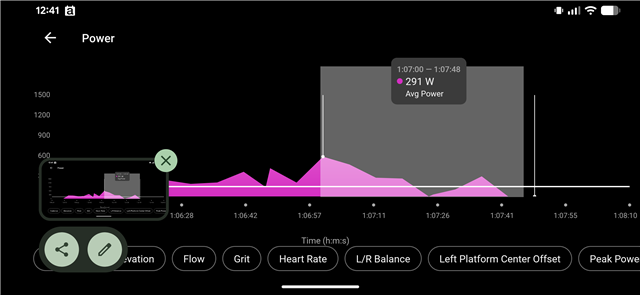
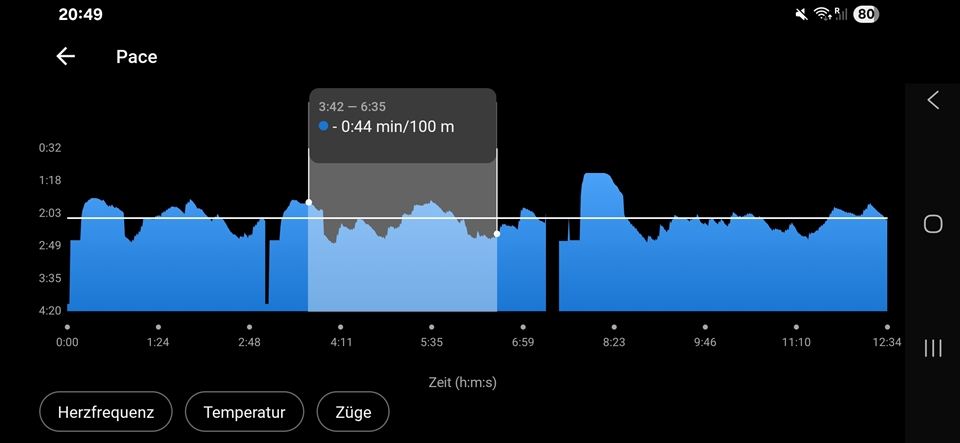
If you zoom in on the charts (e.g. power) of an activity, you can select a section for which the average value is then automatically displayed. There seems to be a bug here that causes values ​​with 0 to be incorrectly included in the calculation. The value 0 appears to be integrated into the average only once, regardless of how long the value 0 lasts.

  • I don't think that the 0 values are included at all. That would explain why it doesn't matter how long time you select with 0 W. 

  • They are included exactly once, look at the following images.

  • I don't get any changes in data when I include the 0 values.

    I think the issue is that the chart in the app doesn't show the "true" data. It is true, but lack all small ups and downs. Look in the web and you will see different data.

    At the top is from the web and the two below are from the app. All charts showing the same ride and time period.

  • Anyway, will Garmin fix this bug? I'm not familiar with the processes here.

  • Question is if it is a bug. It might be by design that it skips all zero values.

    You can always send a bug report to https://support.garmin.com 

    That is pretty much all we can do.

  • They name it "Avg" in the chart and it's calculated wrong in the general case, so it's clearly a bug.

  • It depends on the definition. For example Strava calculates their average paces based on moving time (excluding periods with no effort) too. You may agree or not, however it is just your point of view. Every provider will do what they decide. Some users will prefer it in this way, others in the opposite sense. The best would be offering both ways and let the user to choose, just like they do when they display average pace (including non-moving though not paused periods) as well as average moving pace (excluding non-moving time)

  • It's not only my point of view. They use the arithmetic mean, but arbitrarily exclude 0 values without telling that to the user. It's very very unintuitive, since the mean values on top of the charts do include 0 values.

    What I don't understand neither: If I do this on velocity for the complete activity, the "average" is smaller than the average of the activity / on top of the chart. Seems that they exclude values without explaining on which basis.

  • As I wrote, that is a common practice. If you do not like it, contact Garmin and request a change. However, knowing that programmatically it is actually more complicated to exclude the rests, than to calculate a plain arithmetic average, it is clear it is not a bug, but rather an intentional decision to do it in this way. Possibly because before you, many users requested to have the pauses excluded. All I can recommend you, is to contact Garmin and suggest them to offer both values (plain and moving average).

  • Tried it on a swimming activity. Do you still think it's free of bugs?