This discussion has been locked.
You can no longer post new replies to this discussion. If you have a question you can start a new discussion

V4.70 - Display issues with charts in GC

Hey guys

I've been having an issue since I updated to version 4.70 on Garmin Connect. The charts for my activities don't seem to fit quite right on the page. The y-axis values sometimes stop at 4, cutting off any data above that point.

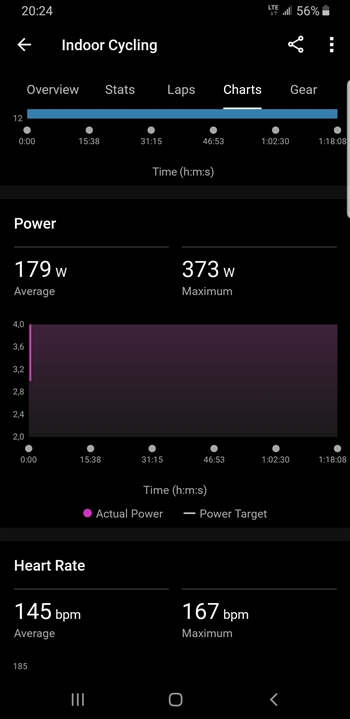
This bug has popped up twice this week, once with the cadence chart and another time with the power chart. Just to double-check, I looked at the measurements in another app, and they seemed fine there. So it looks like it's specifically how the data is being shown in Garmin Connect that's the problem.

Anyone else with the same problem?

Ride earlier this week
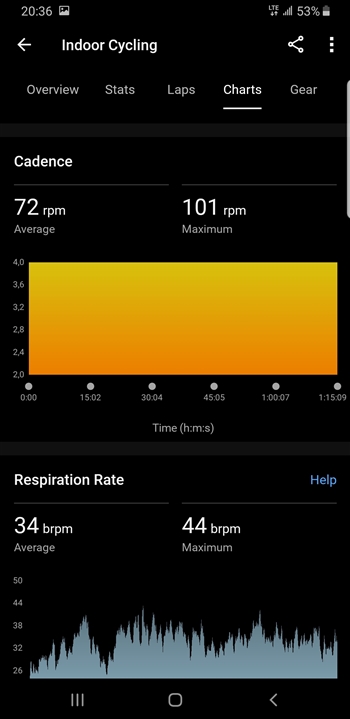
Ride from today

  • Anyone else with the same problem?

    Yes, as mentioned here. v4.70 App Changes Also, you might want to PM Garmin-Cody regarding your specific problems.

    Update as of August 24, 2023: 

    Feedback is currently being reviewed regarding the recent changes made to Garmin Connect 4.70. 

    Please direct message me with the a brief explanation on any concerns with the changes made in the recent 4.70 update, along with the smartphone type you are using, and I will get your feedback submitted directly to our team currently reviewing the changes made. 

    Thank you, 

  • Yup, same issue here. 

  • Just had the same issue with my HR graph after my workout today.  

  • Same here but with truncated speed axis. And power or cadence charts, one or two instances each, were empty but for average and max values floating above. All data was properly displayed on web platform. But I went ahead and rebooted my Edge 840 and, at least for the last 2 rides, no issues with charts. All are scaled properly and populated with data. Not ready to declare success but so far, so good.

  • Hey everyone.

    I just update the GC mobile to the version v4.70.1 and the problem with the charts is solved, even for the previous rides I had. Charts are shown fine now.