This discussion has been locked.
You can no longer post new replies to this discussion. If you have a question you can start a new discussion

I am not sure if the drawing of the Garmin Connect application where the angles of the pedaling amplitude and maximum pedaling phase are shown correspond to the angles indicated by number. Could it be that I am interpreting something wrong?

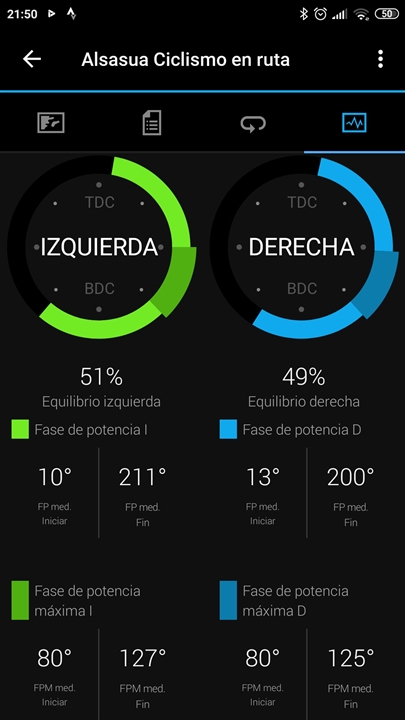
As can be seen in the image, the maximum power of the graph of the right pedal begins later and ends somewhat later despite starting at the same 80 degrees and ending 2 degrees earlier.

  • The peak power phase starts 80 degrees in the power phase. So in the graph it will be at 10+80=90 degrees for left and 13+80=93 degrees for right. That looks right in the graph. 

    Not very intuitive to show the values like that, but that it is how it works in that graph. 

  • Thanks a lot. Logic told me that the maximum power angles would be considered absolute and not in relation to the power start phase angle. Issue resolved.