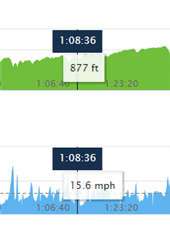
In the Connect app, when viewing a graph and holding my finger on it, a measurement trace line is shown with data point and its label. The label conceals the datapoint so I can't see what I'm looking at
In the Connect app, when viewing a graph and holding my finger on it, a measurement trace line is shown with data point and its label. The label conceals the datapoint so I can't see what I'm looking at