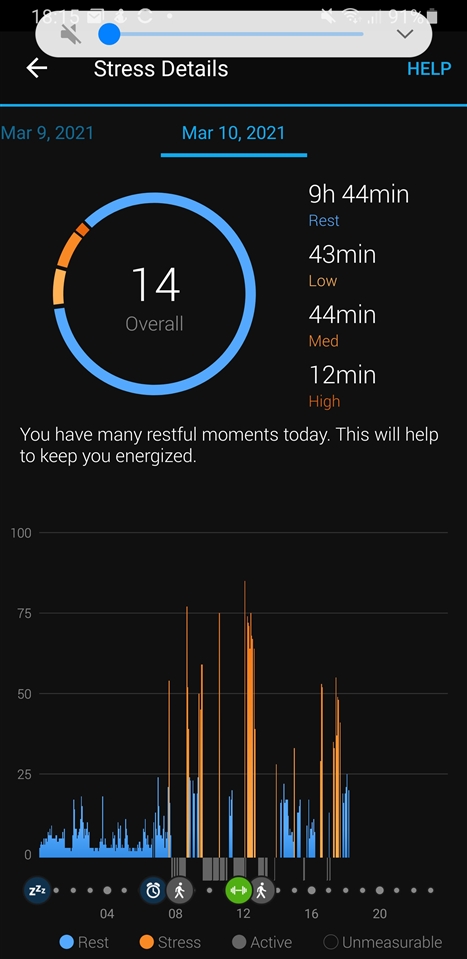
There is no red. There are only three different orange colors in the cirular graph, and their shades are easily distinguishable, since they are side by side, always in the same sequence, and their darkness is increasing, so you cannot really mistake one for another one (unless one section is completely missing).
And in the bottom graph there is only one shade of orange, and one shade of blue. You can see the level of stress on the Y axis scale, so different colors for different levels of stress are not necessary, in this graph at all.
I see, cheers. That explains why I cant see any difference!
Its a shame it can't be changed. The graph is so small a change in colour between different levels would be helpful when trying to view the time of levels.
Just explaining why the colors are not there, and explaining how to read the graph. If you need more colors in the graph, request it from Garmin through the form Submitting an Idea to Garmin, but I doubt it would have any effect.