What exactly do you find odd? If you mean that in reality you were not hiking in that low altitudes, then you may have forgotten calibrating the altimeter before starting the hike. That's necessary doing each time the atmospheric pressure changes (unless the automated calibration is enabled and works fine).
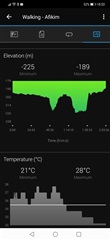
It will be more intuitive for me if the black and green areas inside the chart were swapped
That's the case when you are in positive altitudes. At negative altitudes, the inverted graph is in fact more logical. And personally, for me, it is more intuitive in this way.