This discussion has been locked.
You can no longer post new replies to this discussion. If you have a question you can start a new discussion

Garmin connect HR graph axis

Hi guys, I'm running a garmin forerunner 735xt and garmin connect app on a Samsung galaxy S8.

Has anyone found a way to change the axis values so it's not from 80-220 bpm? It'd also be great if you could view it in 4h blocks and scroll across instead of the 24h period in a single screen! 
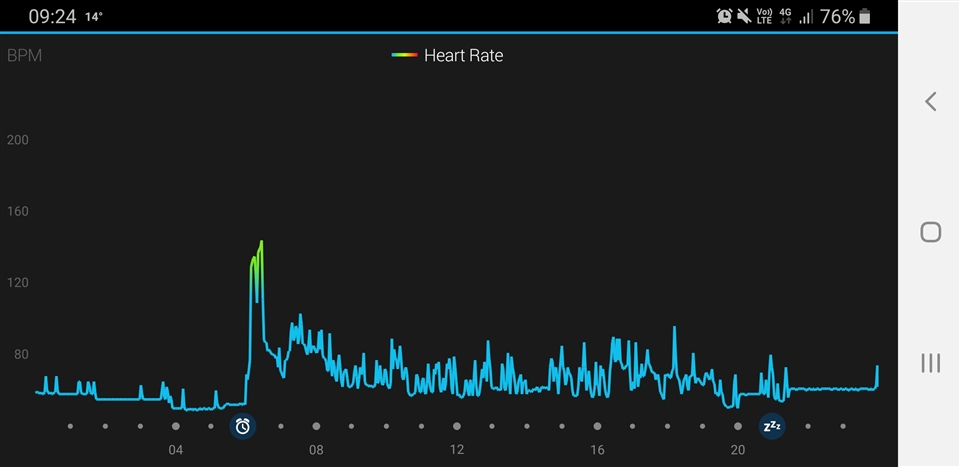
  • You can zoom the X-axis, and view so the graph in a small section with Garmin Connect Web. As for the Y-axis range, that's possbile also in GC Web + local GCOverrides - though currently only on the graphs on the Activity screen. If needed, I could add it to the daily health HR graph too, in the GCOverrides.