This discussion has been locked.
You can no longer post new replies to this discussion. If you have a question you can start a new discussion

Changing the scale of the weight graph

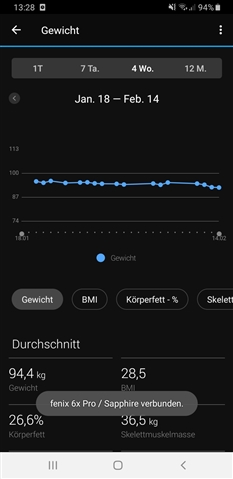
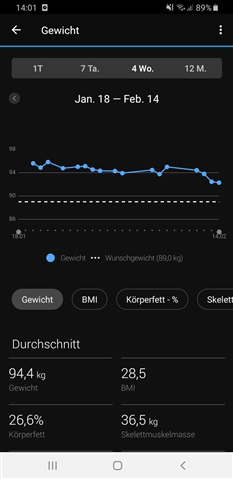
Is there a way to change the scale of the weight graph?

At the moment my graph shows a lower limit of 57kg, and an upper limit of 100kg, meaning that the line showing my actual weight looks pretty much straight!

Must be an easy way to do this (I mean, what if I weigh more than 100kg?), but at the mo it's beyond me!
  • Former Member
    0 Former Member over 5 years ago

    Yes, please fix this garmin! 

  • Former Member
    0 Former Member over 5 years ago

    Garmin, please fix the graph to get an adjustable scale. In my case it shows from 72 to 112 kg. I cant see any difference in this resolution, only a straight line!

    The graph for the weight of the index scale is useless this way in the garmin connect app. You dont see any changes.  It's even worse for BMI and body fat.

    I bought an index scale to monitor the development. And this grafph s not showing anything because the scale is ridiculous broad and there is no way to adjust it!

  • Having an Android phone I can only fully support this request. Out of curiosity I installed the Garmin Connect on my iPad just to be shocked that the graphs are perfectly scaled on the iOS version! Garmin should definitely fix this. It is not just the weight but also muscle mass etc. metrics that you get from the Garmin Index Scale.

  • Former Member
    0 Former Member over 5 years ago in reply to 4336216

    Agreed!!

  • Former Member
    0 Former Member over 5 years ago in reply to Former Member

    Same thing frustrated me, and I know it has worked before. A work around is to enter a value in line with the graph (right weight) in the beginning of the period, that resets the scale to the values during the period. Having said that this is a bug that should be fixed, basics..so please address the issue. 

  • Hm, I do not observe any Y scale problems in my weight graphs on GCM. Can you post a screenshot demonstrating the problem?

  • Former Member
    0 Former Member over 5 years ago in reply to trux

  • Hm, strange. My current 4w graph shows the range of 6kg, which is pretty much all right, because the weight variations are around 4kg in that period. I only see slightly wider ranges - up to 10kg - when I scroll left to the past periods, where the weight was higher and more distant from the Weight Goal.

    I see though that the Weight Goal has an impact on the scale - the graph always tries to keep it in, so when the goal is too far from the current weight, the resulting scale will use a wider range, than with a goal close to your current weight. I see no weight goal in your graph, hence I assume you either did not set any, or it is too far, and does not even fit into the graph. You could perhaps try setting it close to your current weight and see whether it makes any difference.

  • Former Member
    0 Former Member over 5 years ago in reply to trux

    Yes! This does the trick! Now also the other graphs (BMI and other) are scaled better. :-)

  • Former Member
    0 Former Member over 4 years ago

    Backing this up, with or without a goal weight set, the y axis shows a range of over 100lbs, I've tried adjusting goal weights and removing them which have changed nothing about the y axis scale!