Export Graphs From BaseCamp? Help!

Former Member
Former Member

Hello everyone

I recently bought a Garmin GPMAPS 66st partly in order to be able to create printed elevation (or gradient) maps of my travels.

While I can record my trips on the device and BaseCamp does a good job of depicting the track with its graphing function, I can't find any way of transferring those lovely graphs to my PC. I can't even get BaseCamp to export the raw data in CSV format, which would at least allow me to graph the track with Excel.

Does anyone know how to export BaseCamp track graphs? At the moment, I'm resorting to taking screenshots of each individual section, which is very tedious and doesn't look good.

Many thanks for any help you can offer.

John

  • The raw data for tracks only contains the coordinates and date/time.

    What you can do is select a point in the table on the Route Properties tab and type ctrl-a to select all the points.  You can then paste the data into excel.  If your excel has the "Use text import wizard" under Home>Paste use it and choose delimited>next; checking both tab and comma.  Otherwise, you will have to do some text to column transformation under the data tab. 

    The paste will not include the last data point, so add the elevation for that point to your table.  Insert a cell for the first leg value to shift the data down one cell. 

    Then use an equation to create a cumulative distance column.  You can convert the units at this time if you like or as a separate step.  When your done, copy the cumulative distance column and paste over itself with values only.  Clean up your table and create your plot.

    edit:  Adding a cell to the leg column is optional.  Obviously, you can create the cumulative distance without doing this.  My personal preference is to have leg distances at the arrival location rather than the start location.

  • Former Member
    0 Former Member over 5 years ago in reply to BTLAAKE

    What a fantastic, useful answer. Thanks so much! I've pasted data into an Excel sheet and it works like charm.

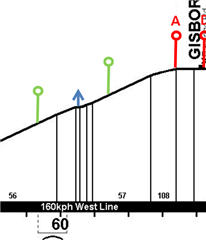
    Now I just have to spend some time on Excel tutorials to figure out how to add feature (eg building locations) to the plotted graph. What I'm trying to do is create something like this, with distance on the X-axis and elevation on the Y-axis, as well as annotations for towns, roads and other infrastructure:

    My instinct is to use Excel, but I'm very open to using (and learning how to use) any other software that can produce grade diagrams. Any suggestions?

    Regards, Paul

  • That's a lot of annotation.  You could do it all within excel.   When you select a chart object, it will have its own set of formatting tools.  These will allow you add lines/shapes/text boxes.  You will be able to change colors/sizes/fonts/orientation for each object.  Overlaying objects can be sent to front or back.

    For the your distance/elevation plot I would choose an x-y scatter showing only the line.  In Excel, you have the ability to format individual points.  This could be used to aid in placing annotations by using "+" marker, or to indicate towns and buildings using different markers - say a circle for towns and a square for buildings.  Individual marker attributes such as size/color/fill can be changed.  The markers can be removed when you are done.

    The only suggestions I can make is to use whatever drawing program you have the most experience.  Any application that will except pastes from the windows clipboard could be used.  For example, if you are adept with PowerPoint, you could do your annotation work in that application.  For your colored circles an lines, once you get the size you like, copy and paste as many as you need and worry about moving them to the proper location later.

  • Former Member
    0 Former Member over 5 years ago in reply to BTLAAKE

    Again, I really appreciate the thought that's gone into your answer.

    I'm not really all that handy with Excel - or indeed with any graphic utility - so I may end up having to find somebody who can take on some of the burden. I can see that it will take a lot of practice for me to get on top of all these functions. I'm also going to want to shade the gradient lines to indicate the severity of the incline (between 0.5% and 2%).

    Your suggestions are very useful. Thanks for the input. Now I just have to get all the location data right and find the right graphic designer to take it on as a project.

    Regards

    Paul