This discussion has been locked.
You can no longer post new replies to this discussion. If you have a question you can start a new discussion

Major Bug: 7-day Training Load graphs of 1 Year and 6 Months are wrong again and different from each other

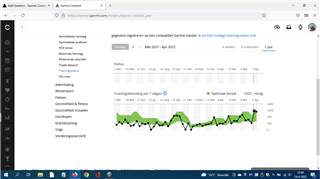
Since a few days the 7-Day Training Load graphs of 6 Months and 1 Year are showing different values for the same weeks and are therefor WRONG AGAIN.

See the screen shots hereunder:

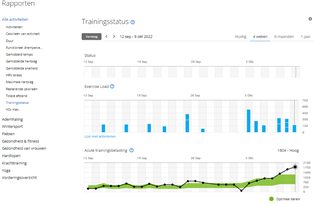
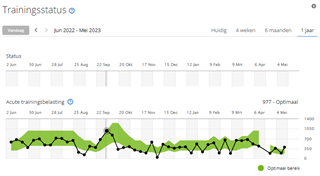
1 Year graph gives 7-Day TrLd of 366 (optimal) and 1023 (high) over last 2 weeks

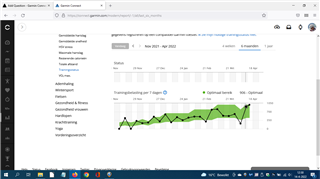
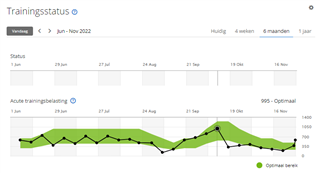
6 Months graph gives 7-Day TrLd of 215 (low) and 906 (Optimal) over last 2 weeks.

Also there are only 24 values in the graph where there should be 26 values, 1 for every week in 6 Months/26 weeks. 

If you take a look at the 6 Months graph of the previous half year it looks even much worse:

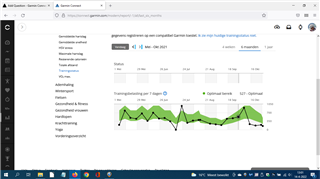
6 Months graph May-Oct 2021:

  • just before 24 July this graph says 7-Day Load of jumping from 0 to 977 High (way above the green bar)  where the 1 Year graph says 299 and 375 (both Optimal) at those weeks
  • there's a strange hickup in the green bar between 24 July and 21 Aug with two values/black data dots in the graph very closely together and again totally different values as in the 1 Year graph
  • in the 19-Sep - Oct period where the green bar ramps up to a high level, in the 6 Months only one value is in the peak of the green bar, then it drops to below. In the 1 Year in that same peak of the green bar there are 3 consecutive optimal 7-Day training load values before it drops below the green bar.
  • At the end of the graph there are again two values very closely together in the graph not having a full 7-day period in between them so also wrong.
  • There should always be 26 7-day training load values black dots in the 6 Months graph (1 for each week). In this one 27 values are displayed which also poves the grapgh is faulty.

This is at least the 3rd time I have reported that these graphs are wrong!

That data is missing, data is wrong, data is inconsistent, data history is changed (a.k.a. f***ed up) every time a new SW release is launched.

GET THIS PROPERLY FIXED FOR ONCE AND FOR ALL and if you don't then at least remove this grey field on the page where you pretend to be accurate because you are not at all Q.E.D.

  • Same Major Bug has returned again:

    Hereunder the 7 Day Training Load of 1804 for Sunday 9th of October is shown which is correct.


    The 6 Months graph displays only 995 for that week and the 1 Year 977. Both values are wrong and also different from each other!

    There is also an unexplainable gap in the green bar which should display the optimal training load zone.

    Who has put this old very crap SW version back in again at Garmin? 

    PUT THE RIGHT SW VERSION BACK IN SO THAT:

    1. The 7 Day Training  Load per week is always the Sunday value;
    2. There is no gap in the Optimal Training Load green bar
  • I believe you are comparing different dates. When I check the 6 month and yearly graph I see the load for Wednesdays. Not Sundays.

    Garmin don't always use Sunday to Saturday or Monday to Sunday. Instead it is often rolling weeks. So the start and end depends on the day you look at the graphs.

  • That is exactly the MAJOR BUG which Garmin must fix! and they have a SW version where it is all correct because that was live the last couple of weeks.

    The concept of the 'rolling weeks' is utter nonsense. They should push the Sunday (if you set your calendar to start at Monday) value from the 4 Weeks graph to the 6 Months and 1 Year graphs instead of doing the same calculations 3 times from which two times (6 Weeks & 1 Year) are wrong. If I would have done this in this way when I was a student I would have been dismissed from college.

  • So the values are correct but you are looking at different dates? The issue here that you should send to Garmin is to break the weeks on the same day. Everything else is correct, right?

  • NO.

    The 7-Day Training Load values in both the 6 Months and 1 Year graph MUST be the Sunday value because that is the calendar option I chose in the Garmin settings for making the Training Plans. 

    If I would have chosen the only other option of starting the training calendar week at Sunday, then the values should be the Saturday value.

    Any other 7-Day training Load value taken at any other weekday in the 6 Months and/or 1 Year graph is BY DEFINITION WRONG because it is out of sync with the training plan.

  • Must it be that? I checked in my report and today it is showing Wednesday. 

    How is it out of sync with the training plan? It doesn't matter what values you see. It is just a view of the values. Is it the Garmin training plans you are referring to? 

  • Yes of course this must be on the Sunday or Saturday dependent on  your personal setting in the Garmin and of course also in the 6 Months and 1 Year at the same day.

    And I find it an extremely st***d remark that the values wouldn't matter. They do matter majorly!

    If you would have looked at the 4 weeks graph you can see that in that week ending on Sunday 09-October the 7-Day Training Load at the end of that week was way much higher than should be. In both the 6 Months and 1 Year graph it show a wrong and different value which falls within range so that's very inaccurate and misleading. Furthermore the week after the heavy overload, the 6 Months shows a value way UNDER Optimal where the 1 Year shows WITHIN Optimal in that same week! How much more clear should it be that this is a major f**k up in both graphs which ruins any possible longer term training analysis